The short history of aviation shows how a ‘new’ mode of transport can emerge and have a substantial impact on travel. Air travel has also transformed business activity, as many international activities are dependent on being able to get almost anywhere in the populated world within 24 hours for both passengers and for high-value freight. In this sense, the world has ‘shrunk’ and globalization is now totally dependent on long-distance high-quality supply chains, and these patterns of movement in turn enable specialization and the concentration of economic activity in those locations where it is most efficient to produce (and consume). The growth in the long-distance leisure market has also opened up opportunities for people to fly to destinations that had previously only been accessible through TV programmes and films. Similarly, as global barriers to movement have been reduced and as education has become a global business, personal and business networks have also become global, with visiting friends and relatives now becoming the fastest growing part of the world passenger travel market. As individuals’ networks extend through personal contacts and social media, the net result is that more long-distance travel is likely to be generated.
This global picture conceals a much more complex reality in terms of inequalities of access to this new form of transport. In the UK, the numbers of air passengers have grown a hundred times from 2.13 million (1950) to 210.66 million (2010), even though there has been a recent downturn as a result of the economic recession (about a 12 per cent fall – Rutherford, 2011). Some 53 per cent of adults in the UK claimed not to have flown in the previous 12 months (DfT, 2010), and of those that have flown (47 per cent), some 37 per cent had taken a short haul international flight, and 18 per cent had taken a long haul international flight. A further 8 per cent has used the UK domestic air services. Of those who had flown, 20 per cent had taken only one return flight, 11 per cent had made two flights, and about 6 per cent had taken 3 flights, with 10 per cent accounting for four or more flights – this suggests that 10 per cent of the total population are making over 60 per cent of all flights.
This figure of about a half of the adult population flying in any one year does not seem to have changed over the 10 year period (2002–2012). The growth in air travel appears to be coming from those who are already travelling and from this ‘it can be inferred that passenger growth in recent years is coming at least as much from an increased flying frequency by those that do fly, as from a diminishing pool of non-fliers’ (CAA, 2008, p. 55 and table 5.5).
Table 5.5. Number of leisure flights in the last 12 months taken by individuals (2007) and market structure for overseas travel by UK residents (2002–2012).
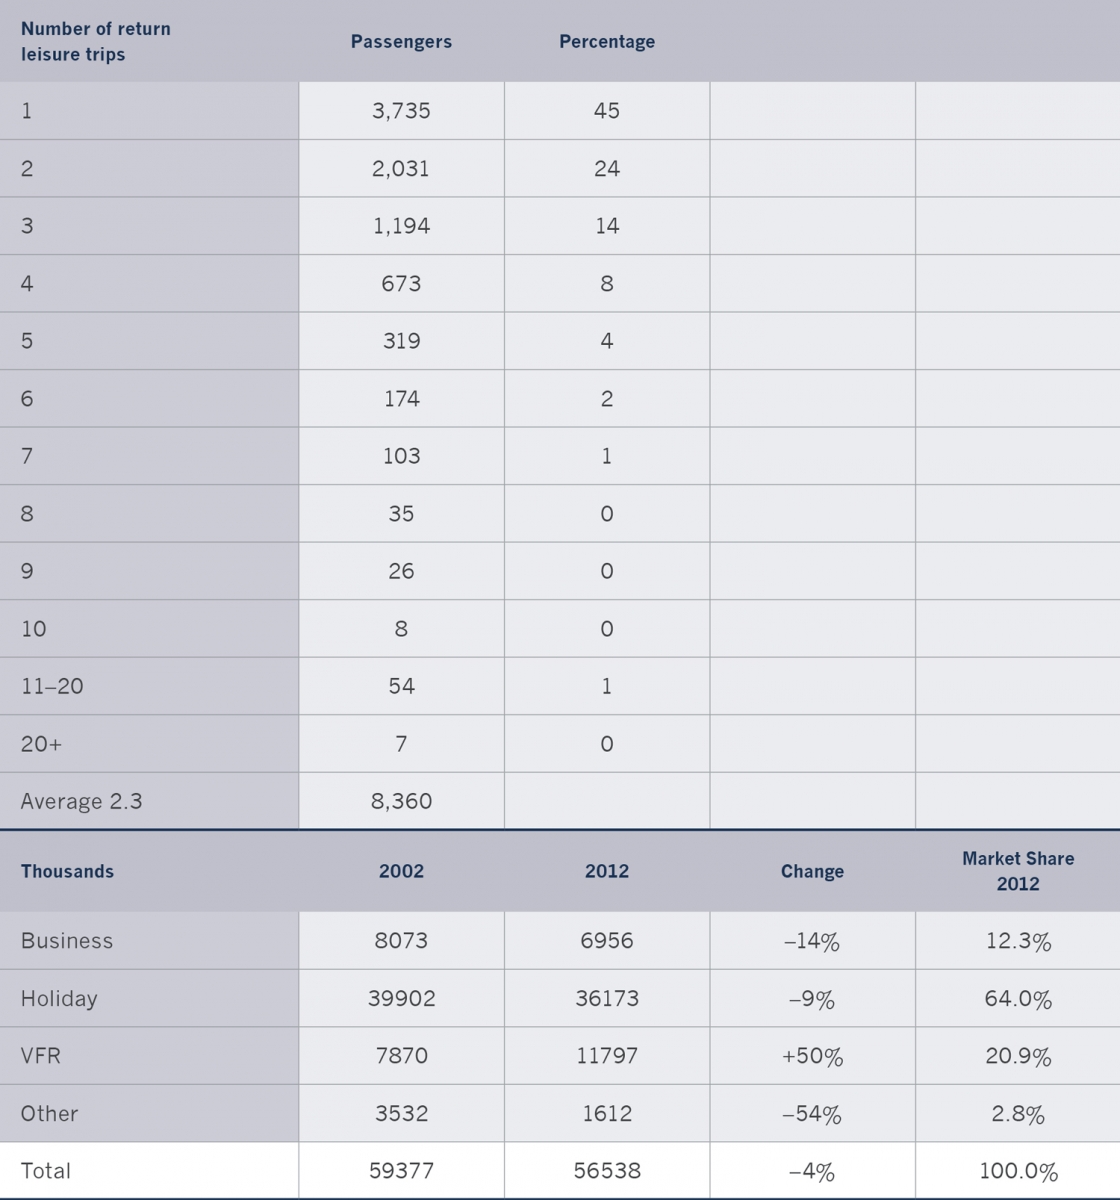
Notes: Air accounts for about 80 per cent of all overseas travel and these data relate to UK residents’ visits and nights abroad – the other modes are sea and channel tunnel. It demonstrates the huge growth in VFR (Visiting Friends and Relatives) and the overall importance of leisure travel (64 per cent). It also shows that business travel accounts for about 12 per cent of overseas travel and that this has decreased by 14 percent over the 10 years. Note that leisure is equivalent to non-business travel.
Sources: CAA, 2007, table4.1, and DfT, 2015.
If the latest survey data are used (DfT, 2014a), the picture is much the same (Annex 5.2), with 52 per cent of respondents making no flights in the previous 12 months (March 2014). Income has a very strong impact on flying, with 71 per cent of those living in households with an income less than £8,319 making no flights in the previous year, and 44 per cent of those living in households with income levels over £26,000 making two or more flights a year (2014). Analysis carried out on leisure travel by UK residents found that those with either an income over £115,000 or owning a home overseas increased the number of flights by 60 per cent (to 3.4 a year), and if both conditions were met, it doubled the number of leisure flights (to over 5 per year) (CAA, 2008). This distribution
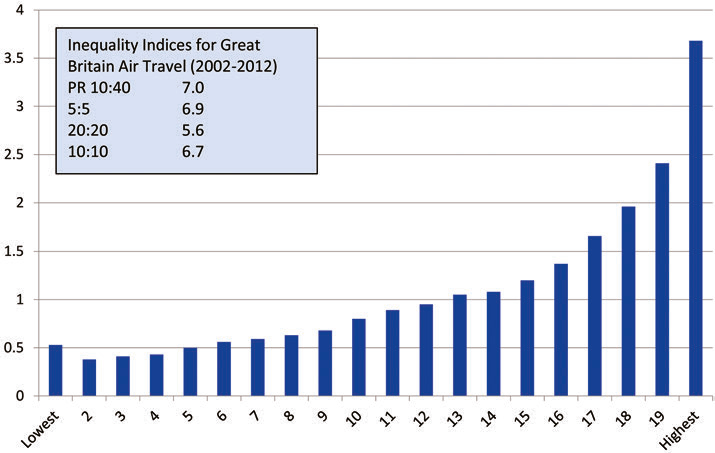
can be clearly seen from figure 5.4 where the average frequency of air trips per person per year over the review period (2002–2012) is shown by income ventile.
A similar picture is presented in a study that examined the distributional aspects of CO2 emissions from households in the UK for domestic fuel (about 58 per cent of the total) and transport (the remaining 42 per cent), including aviation (Gough et al., 2012). Overall, the richest 10 per cent of households produced three times the levels of CO2 of the poorest 10 per cent of households, but for transport the difference was 7–8 times overall and 10 times for aviation. On an individual level, similar conclusions were reached (2006 data), as the 10:10 Ratio was 4.5 for transport (table 5.6). This was the largest ratio found across all the seven sectors analysed. These seven sectors covered domestic energy and housing, food, consumables, private services, transport, other, and public services. Further investigation through regression analysis covering all forms of transport (including aviation and holidays abroad) concluded that a £5,000 increase in annual equivalized income leads to an increase of 9.7 per cent in CO2 emissions in the transport sector.
Table 5.6. Per capita GHG emissions by (equivalized) income decile for UK (tonnes).
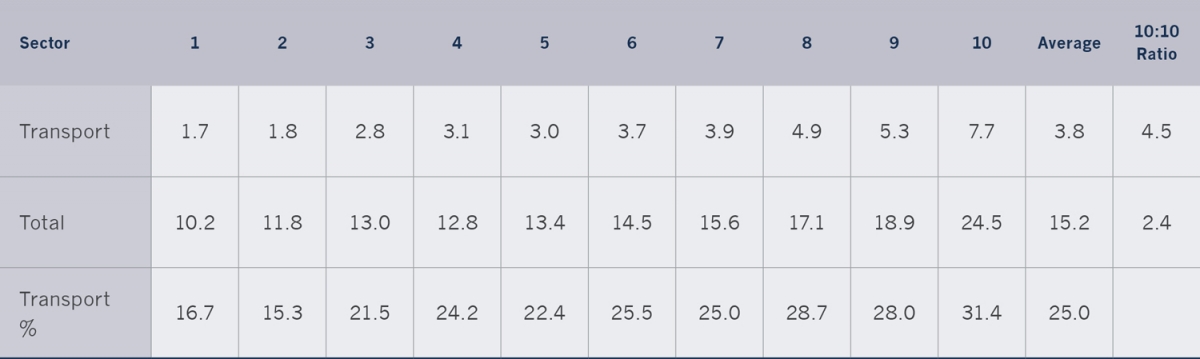
Source: Gough et al., 2012, based on table 4.
The advent of the low-cost airlines in the 1990s has added a new complexity to the picture, as it has both increased seat availability and potentially widened the market. Air travel has become more affordable, but as noted above this has not resulted in more people flying, as those levels have remained stable at around 50 per cent of the adult population. The 26 per cent who make two or more flights a year account for about 80 per cent of all flights, and just 6 per cent make 40 per cent (2010 and based on Rutherford, 2011 and DfT, 2014a). It seems that the low-cost airlines have allowed those who are already flying to fly more frequently and possibly to save money.
A survey carried out at Lisbon airport on low-cost airline passengers (2013– 2014) concluded that 67 per cent have a university degree or higher, a further 7.5 per cent were at university, and 6.7 per cent retired. At the time of the survey (2013–2014), the low-cost airlines at Lisbon covered 31 services, 18 operated by EasyJet, 4 by Ryanair, 4 by Transavia, 2 by Vueling, and 1 by each of Air Lingus, German Wings, and Norwegian.3 Travellers were mostly flying for leisure (48 per cent) and visiting friends and relatives (43 per cent), but these were mainly infrequent flyers. It was the business travellers (remaining 9 per cent) that were the most frequent flyers. About 40 per cent of these made only one flight, but a further 40 per cent made 2, 3, or 4 flights a year. The remaining 20 per cent made 5 or more flights each year, with 2.4 per cent of these making over 20 flights a year. The overall picture at this one airport for low-cost airlines is similar to the pattern found elsewhere, with 40 per cent of flyers making 10.8 per cent of trips, with the next 40 per cent making 28.9 per cent of trips, and the top 20 per cent accounting for nearly 60 per cent of trips (Observatório Turismo de Lisboa, 2014).