Rail is not used by all people and here the focus is on understanding the variability in patterns of rail use by different people. In the period 1998–2000, 49 per cent of those living in Great Britain made any use of the railways. By 2012, this proportion had increased to about 58 per cent, and of those that use the rail network, about half do so regularly, five or more times a week (i.e. those that commute by rail). A further 15 per cent use rail 2–4 times a week, 14 per cent monthly, and the remainder are less frequent users. About 71 per cent of rail users are aged between 25 and 59 (about 47 per cent of the population is between 25 and 59 years), and there is a strong income effect. About 78 per cent of all rail trips are made by those with an income level over £17,500 (when the median income was £21,000 in 2012–2013). About 48 per cent of rail trips were made by those with an income in excess of £35,000 per year, with about half of these travellers having an income over £50,000 (HS2, 2011).
As already noted (Chapter 4), rail is mainly used for commuting (42 per cent of rail trips), business (9 per cent), and leisure (27 per cent), and there is a strong spatial concentration of use in London (48 per cent of all use) and the South East (14 per cent). There is also a concentration within London, as 68 per cent of the London trips take place within the conurbation, and a further 16 per cent and 12 per cent are made to the South East and the East of England respectively. This same pattern is repeated in these two regions, but to a lesser extent. Regional trips for the South East account for 27 per cent of trips, and the corresponding figure for the East of England is 17 per cent, with a further 66 per cent and 76 per cent of trips to London. These figures give a clear indication of the dominance of London and the South East and East of England in determining both the national and regional patterns of rail travel in Great Britain (DfT, 2014b).
This background strengthens the discussion based on the NTS data presented earlier (Chapter 4), and the focus on the London dominance in all rail travel. When these patterns are examined for long-distance travel (tables 5.2 and 5.3, and figure 5.1), there are clear links to income. The dominant mode for long-distance travel (>50 miles in figure 5.1) is the car, but rail provides strong support. The importance of rail is particularly evident with respect to weekday travel for business and social activities, with car travel being more evenly spread by both time and purpose. The patterns of travel by distance are similar for rail and other modes (mainly the car).
Table 5.2. Long-distance travel in Great Britain (>50 miles) 2002–2014.
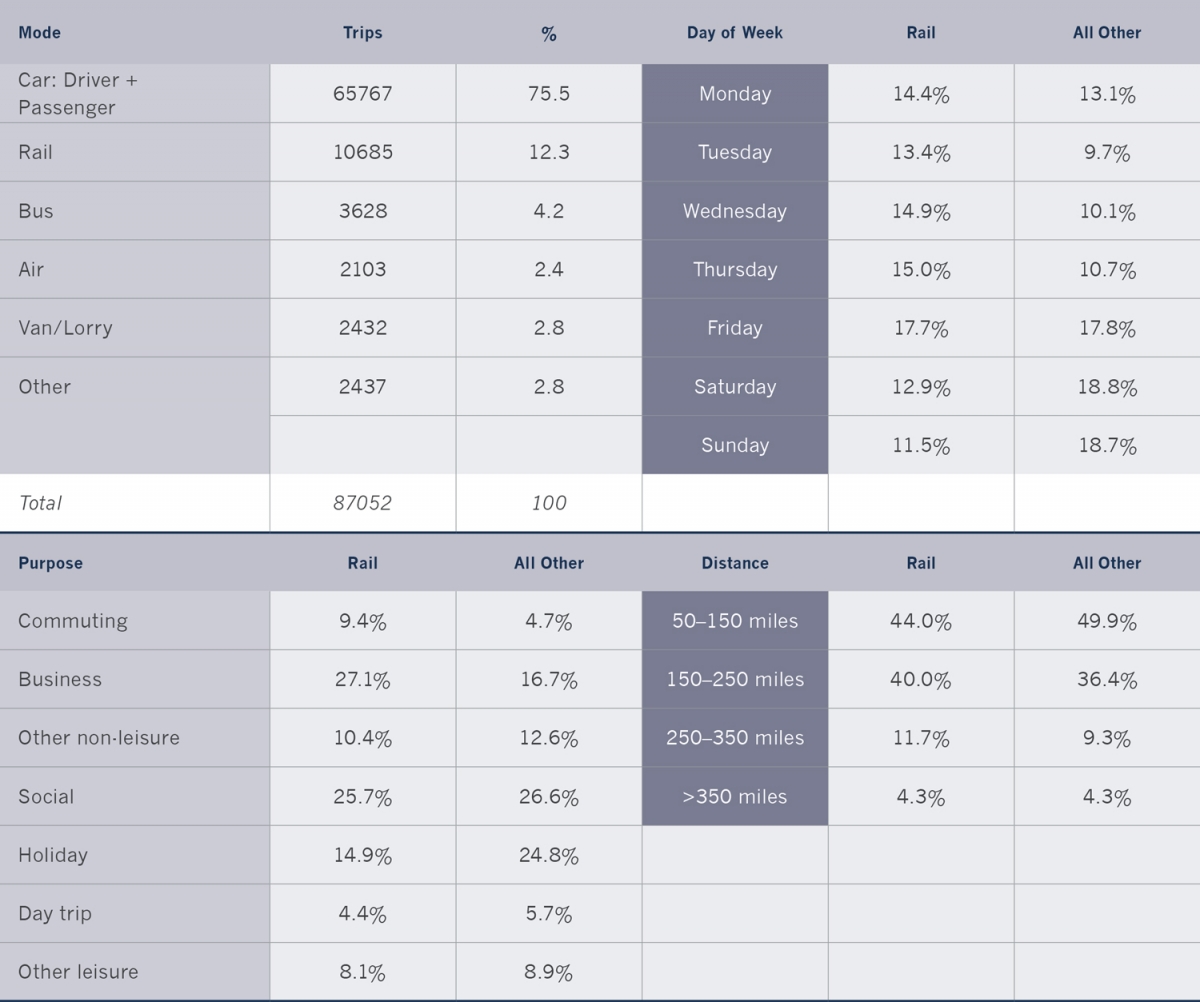
Notes: Other mode excludes rail, but is mainly made up by the car driver and passenger (about 86 per cent of trips). The NTS covers Great Britain for the period 2002–2012 and only England for the period 2013–2014.
Source: NTS, 2002–2014.
Table 5.3. Annual average long distance trips (>100 miles) per person (Great Britain) by income quintiles (2006–2009).
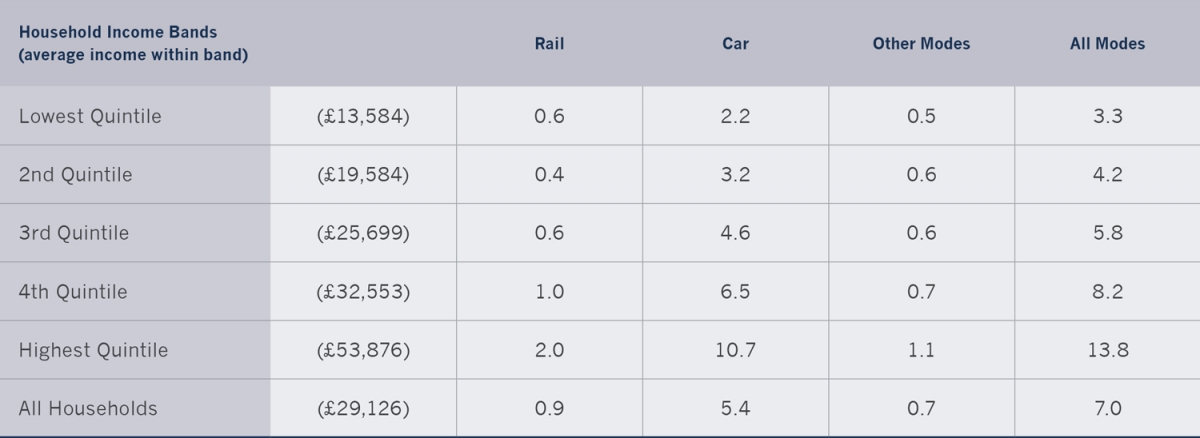
Note: Long distance (>100 miles) from the combined NTS surveys (2006–2009).
Source: HS2, 2011.
The distribution of long-distance travel by rail and car is given for income quintiles over the period 2006–2009 (table 5.3). The actual income levels are given, and the use of rail and other modes demonstrates the income effect, with the rail figures being in line with the other modes. This means that the top 20 per cent make twice as many long-distance trips as the average, and 4.2 times as many as the bottom 20 per cent.
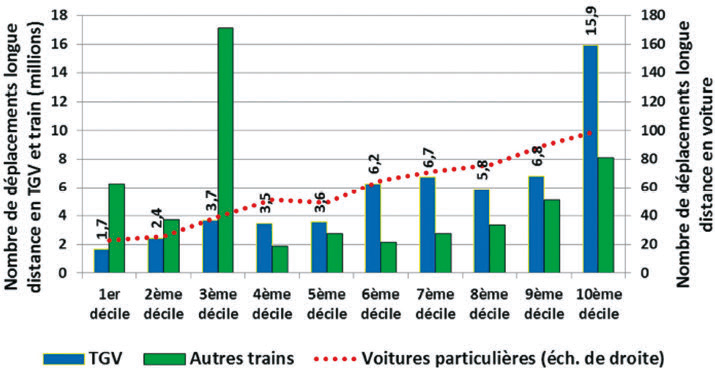
When thinking about long-distance rail, it is important to examine the potential of and the role for high-speed rail (HSR), which in the UK has played only a limited part in the renaissance of rail use over the last 20 years. For a more complete picture, one has to look at the experience of other countries, principally France, that have a network of HSR routes. It is likely that there are strong similarities between the income profile of users of HSR in the UK and the Train á Grand Vitesse (TGV) in France.
In France (figure 5.2), about 30 per cent of the users come from the highest income decile (15.9 million out of 56.3 million users). The Cour des Comptes (2014, p. 35) concluded that TGV was mainly used by higher income people, and that this pattern was different to long-distance car users or other rail users. There is a Factor 9.5 for TGV users between the highest and lowest income deciles, whilst the corresponding figure for long-distance car use is Factor 4.4.
The TGV network in France is comprehensive, as it serves 230 stations, but this means that about 40 per cent of its time is spent on the conventional network at lower speeds. The Cour de Comptes Report also examined use of TGV in France by different types of geographical area, again emphasizing the complete dominance of Paris, the Paris suburbs and other communities in the Paris area, followed to a lesser extent by use in the larger urban areas outside Paris (Cour des Comptes, 2014 and annex 5.1). The situation in the UK reflects that in France, even though there is a much less well developed HSR system, as the complete dominance of London in all rail travel is apparent, covering both long-distance travel and HSR. This position is comparable to that of Paris. That dominance has also now spread to the wider commuting regions of both capitals.
All fourteen countries with HSR systems have different characteristics (Banister and Givoni, 2013). The total number of passenger-kilometres in the French HSR is about 56 billion per year, and this figure has remained stable for the last 5 years. The growth period has finished, and the Cour des Comptes (2014) report is timely, as it is a reflection on the scale, nature and vision behind the HSR concept in France. The conclusion is clear, namely that new high-speed rail projects must provide long-distance transport that is ‘accompanied by greater guarantees of relevance and profitability’. The societal issues are as important as those relating to profitability and use, and the growth of HSR needs to be balanced against other priorities in the rail sector and in the transport system as a whole.